 With a year-over-year growth rate of over 70 per cent, the Asia-Pacific region has been our fastest-growing region for the delivery of ad impressions this year, with India leading this rapid expansion of ad traffic by increasing its delivered impressions by over 260 per cent since July 2013.
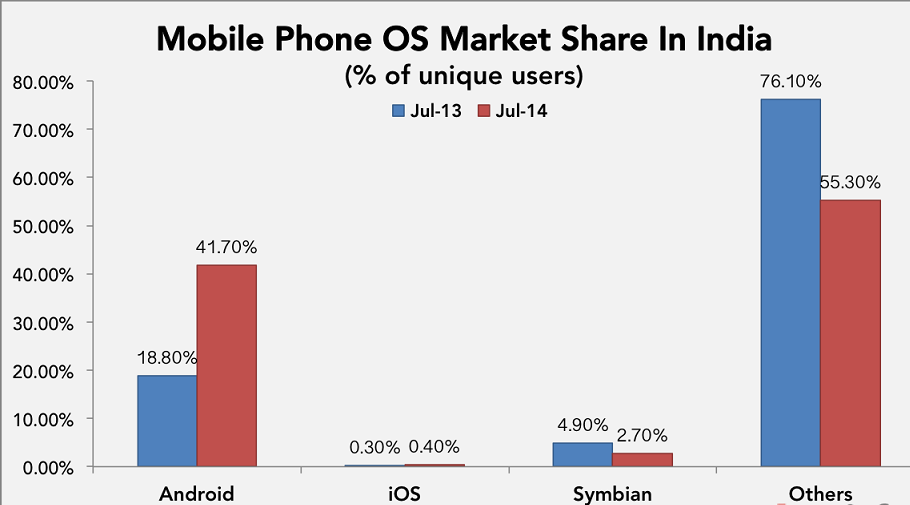
Coupled with this rapid growth of ad traffic is an aggressive transformation of the marketplace from one dominated by less capable feature phones to a transformational market, with Android devices emerging as the market leader, according to a study by Opera Mediaworks in its special edition of the State of Mobile Advertising Report.
The future is bright for the mobile advertising business in India. This market continues to grow aggressively and is rapidly transitioning to advanced smartphone platforms, led by Android.
With this growth and technological transformation, we believe the market presents tremendous opportunity for mobile sites and applications focused on delivering richer experiences in categories with higher monetisation potential, as we’ve witnessed on a global level.
While India is still one of the global leaders in retaining older feature phone models, and the Symbian platform continues to hang on, it is significant to note that iOS struggles to make inroads.
Overall, however, mobile users are shifting to “smart” devices — and with that transformation comes an increasing number of interactions with mobile services and advertising.

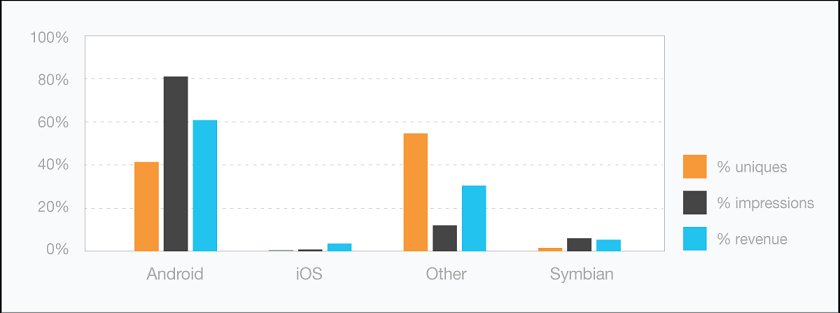
As with many markets, there are major differences when one views market share based on the number of unique devices, the number of impressions served or the amount of revenue earned (eCPM).
India is no exception to this rule, and while Android follows other devices (predominantly feature phones) in market share, it is the clear leader in impressions served and revenue production.
However, iOS clearly outpaces the competition for its ability to produce ad revenue on a fairly small market share, producing over 2 per cent of total revenue on just 0.5 per cent of total ad impressions.
India differentiates itself from other countries and regions in many other respects, as well. For example, when comparing the top mobile site categories supported by Opera Mediaworks’ advertising technologies globally, India presents a significantly different mix of media types.
In both our global and India markets, social sites and apps lead the mix. However, India shows a significantly higher use of mobile app store sites (most with significant mobile games catalogs), gaming and education-oriented sites. Interest in music and other streaming media sites fall well below our global average, along with News & Information, and Arts & Entertainment.
It is also significant to note that many of these sites and apps are accessed through a mobile operator/carrier portal, which is very different from our experience in the United States and Europe, but more common in Asia and Africa.
The site category types and their accompanying user experience models, when coupled with a device mix that remains predominantly feature phone, result in advertising models significantly different than those experienced in the United States and parts of Europe.
For example, simple banner ads dominate the Indian market, with only 3.2 per cent of impressions being rich-media creative. It is very promising to see, though, that over 26 per cent of revenue comes from rich media, and it clearly shows the huge potential for this market as more users adopt advanced device platforms.

The dominant advertisers in the market focus on selling games and mobile devices, at 25.5 per cent and 22.7 per cent, respectively. Classifieds are also an important part of the ad economy, with about one in five ad impressions being for items like cars and bicycles via classified ads.
Through our research on the market we found the India audience is predominantly young and male. The 18-24 age group accounts for over 60 per cent of all users, while males make up 82 per cent.
Over 64 per cent of users access mobile sites and apps on a weekly basis. The most popular period for these interactions is during the weekend, with a slightly lower tendency to engage at mid-week. This day-of-week fluctuation is driven to a large extent by older feature phone users who show a much more pronounced decrease in activity at mid-week than do Android users.
During the week, about half of unique users (49.5 per cent) are classified as “occasional” users. These users access the mobile web one or two days per week. The next largest group of users (28.9 per cent), is regular users (using the mobile web three, four or five days per week). Finally, 21.6 per cent are frequent users (accessing six or seven days per week). Over 60 per cent of impressions are served to users classified as “frequent”.
Because so much of today’s ad traffic in India is driven by older technology feature phones, we thought it instructive to look specifically at user behavior on Android devices.
As with the total audience, Android users flock to social-networking sites and apps. Disregarding this category, however, leads to several observed differences in audience behaviour. First, it is significant to note that interest in app stores and carrier portals is far less for the Android audience than for the audience in general. We believe this is the result of two factors. Primarily, it is likely caused by the heavy reliance feature phone users have on their carrier portals and different mobile stores and portals for content. It is also likely a reflection of our customer base, which does not include Google Play.
Therefore, to gain more clarity into the different behaviour exhibited by the Android audience, we have eliminated the category from the graphic view, to the right. The resulting differences in user behavior between the total India audience and the India Android audience are marked.
Android users are far more likely to engage with Arts & Entertainment, News & Information, as well as Business, Finance & Investing sites and apps than the audience in general.
When these facts are considered in light of the revenue generation and monetization potential for these categories we see on a global basis, a critical opportunity emerges for the marketplace, as it transitions to Android and other more advanced devices.
On a global basis, Arts & Entertainment and News & Information combine to generate over 30 per cent of the revenue managed on our platform. Compare this with the just over 4 per cent of revenue we see for these categories in India. However, when we compare our global ad traffic with India’s Android audience interest, we see more similarity and, therefore, great opportunity.
India’s Android audience interest in News & Information sites is much more closely comparable to our experience delivering ad impressions globally than is the total Indian audience.
News & Information publishers collectively account for just over 13 per cent of the revenue we manage for publishers globally. This is far above the 6.7 per cent we see in India.
However, this opportunity pales in comparison to that presented by the Arts & Entertainment category. As shown on the chart above (which disregards traffic from social and application store and portal sites), the Android audience in India for Arts & Entertainment is larger than what we experience for ad traffic globally.
Globally, these publishers account for just under 8 per cent of traffic (12 per cent disregarding social, app and portal) but they generate 17.6 per cent of the total revenue managed by our platform.
